Your First Script
The most common type of jobs are batch script jobs submitted to the scheduler using sbatch command. In this example we are
submitting a script called "my_script.sh":
sbatch my_script.sh
SLURM will try to find the suitable resources for the job as defined in the file and than launch the execution on the selected nodes.
Creating Batch Scripts
A batch script is typically organized to the following sections:
- the interpreter to use for the execution of the script: bash, python, ...
- SLURM directives that define the job options: resources, run time, partitions, ...
- preparation steps: setting up the environment, load modules, prepare input files, ...
- job execution: run the application(s) with appropiate command
- epilogue: post processing and cleaning the data, ...
As an example, let's look at this simple batch job script:
#!/bin/bash
#SBATCH -J "slurm test"       #JOB NAME
#SBATCH -N 1                  #NUMBER OF NODES
#SBATCH --ntasks-per-node=16  #NUMBER OF TASKS PER NODE
#SBATCH -o test.%J.out        #STDOUT FILE, %J will be replaced by JOB_ID
#SBATCH -e test.%J.err        #STDERR FILE

module load intel             #LOAD THE MPI ENVIRONMENT

mpirun /bin/hostname          #RUN YOUR APP IN PARALLEL

exit
This script defines only a minimal job requirements, such as number of nodes and tasks, standard output and error files and then runs
hostname command (which displays the server name) in parallel.
login01:~$ sbatch my_script.sh
  Submitted batch job 38678

login01:~$ ls -ltr
  total 8
  -rw-rw-r-- 1 user user 198 Sep 21 14:08 my_script.sh
  -rw-rw-r-- 1 user user   0 Sep 21 14:08 test.38678.err
  -rw-rw-r-- 1 user user  80 Sep 21 14:08 test.38678.out

login01:~$ cat test.38678.out
  n079
  n079
  n079
  n079
  n079
  n079
  n079
  n079
  n079
  n079
  n079
  n079
  n079
  n079
As you can see, the job's ID was 38678 (displayed right after job submission). As expected, this number
was also used in STDERR and STDOUT file names. Since we requested 16 tasks on one node, the output file
contains 16 outputs of hostname command (and you can see the script was actually executed on n079).
Obviously, this is just a demonstration script and if you want to use it for a real HPC application, you have
to modify it accordingly. You can find more examples for specific applications in the "Software" section
of userdocs portal.
Job Submission
At a minimum a job submission script must include number of nodes, time, type of partition and nodes (resource allocation constraint and features). If a script does not specify any of these options then a default may be applied.
Task distribution options
| Option | Description |
|---|---|
-a, --array=<index> |
Job array specification (sbatch only) |
--cpu-bind=<type> |
Bind tasks to specific CPUs (srun only) |
-c, --cpus-per-task=<count> |
Number of CPUs required per task |
--gpus-per-task=<list> |
Number of GPUs required per task |
--mem=<size>[units] |
Memory required per allocated node (e.g., 16GB) |
--mem-per-cpu=<size>[units] |
Memory required per allocated CPU (e.g., 2GB) |
--nodes |
Number of nodes to be allocated to the job |
--ntasks |
Set the maximum number of tasks (MPI ranks) |
-N, --nodes=<count> |
Number of nodes required for the job |
-n, --ntasks=<count> |
Number of tasks to be launched |
--ntasks-per-node=<count> |
Number of tasks to be launched per node |
Within a job, you aim at running a certain number of tasks, and Slurm allow for a fine-grain control of the resource allocation that must be satisfied for each task.
Beware of Slurm terminology in Multicore Architecture!
- Slurm Node = Physical node, specified with
-N <#nodes>- Always add explicit number of expected number of tasks per node using
--ntasks-per-node <n>. This way you control the node footprint of your job.
- Always add explicit number of expected number of tasks per node using
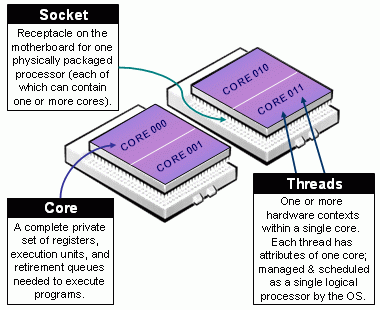
-
Slurm CPU = Physical CORE
- Always use
-c <threads>or--cpus-per-task <threads>to specify the number of cpus reserved per task. - Hyper-Threading (HT) Technology is disabled on Devana cluster.
- Always use
-
Assume cores = threads, thus when using
-c <threads>, you can safely setto automatically abstract from the job context.OMP_NUM_THREADS=${SLURM_CPUS_PER_TASK:-1}
The total number of tasks defined in a given job is stored in the $SLURM_NTASKS environment variable.
The --cpus-per-task option of srun in Slurm 23.11 and later
In the latest versions of Slurm srun inherits the --cpus-per-task value requested by salloc or sbatch by reading the value of SLURM_CPUS_PER_TASK, as for any other option. This behavior may differ from some older versions where special handling was required to propagate the --cpus-per-task option to srun.
In case you would like to launch multiple programs in a single allocation/batch script, divide the resources accordingly by requesting resources with srun when launching the process:
srun --cpus-per-task <some of the SLURM_CPUS_PER_TASK> --ntasks <some of the SLURM_NTASKS> [...] <program>
Basic accounting and scheduling options
| Option | Description |
|---|---|
-A, --account=<account> |
Charge resources used by this job to the specified user project. |
-e, --error=<filename> |
File in which to store job error messages (sbatch and srun only) |
--exclusive |
Reserve all CPUs and GPUs on allocated nodes |
-J, --job-name=<name> |
Job name |
--mail-user=<address> |
E-mail address |
-o, --output=<filename> |
File in which to store job output (sbatch and srun only) |
-p, --partition=<names> |
Partition in which to run the job |
-t, --time=<time> |
Limit for job run time |
A full list of variables that specify data handled by sbatch can be
found with the man sbatch command or by visiting the slurm documentation on
sbatch.
Monitoring CPU Usage of Running Jobs
Once a job is launched you will be provided with a job number. This is immediately returned after submitting the job. For example:
login01:~$ sbatch my_script.sh
  Submitted batch job 38678
In the example above, "38678" is our job number. If you miss recording that number, there are other ways you can find it. One is to use "squeue":
login01:~$ squeue -u user1
  JOBID PARTITION     NAME     USER  ST       TIME  NODES NODELIST(REASON)
  38678 long          myjob.sh user1 R        3:35      2 n[007-008]
In the example above, we specify the user filter "-u" to limit the returned jobs to only those that we own.
Here we can again see the JOBID 38678. We can also see the column "NODELIST" which shows us we are
running on nodes n007 and n008. Knowing which nodes our job is using are essential for monitoring job performance.
Once you know what node(s) your job is running on, you may access it directly using SSH. For example, if your job is running on n007:
login01:~$ ssh n007
The most direct way to monitor your running job will be to login to respective node using SSH, and use various tools to examine key performance indicators, such as load, memory usage, threading behavior, etc.
Useful Command Line Tools
Many commands can be accessed directly from the shell, and some others are provided as module file installations. Some commonly used commands include:
- top - shows a list of running processes, with summary of CPU utilization, memory usage, etc.
- free - shows memory utilization. Add a flag like "-g" to show memory usage in gigabytes.
- vmstat - display memory usage statistics
- lsof - "list open files" is useful for showing open files that are being read and/or written to
- uptime - shows system loads for 1, 5, and 15 minute averages, respectively
- ps -e - shows actively running processes
- pstree - shows a schematic process tree
Each of the commands above may be issued as-is, or with various modifying flags.
Other commands like "grep" may be useful for filtering command output to isolate items of interest.
The options for how these commands may be used is virtually limitless, and this document cannot hope to cover them all.
You can find out command options for any of these by using the "man
Uptime command and node load
The uptime command is useful for determining the "load" on a compute node. Devana CPU and GPU nodes have 64 processing cores each. If the processes running on that node match the capacity of one processing core, the load would be "1" (or 100%). Therefore, if the processes on a node are fully utilizing all processing cores, we would expect a maximum of load of about "64".
n007:~$ uptime
  13:56:51 up 150 days,  22:48,  1 user,  load average: 64.09, 63.72, 63.49
Top command and module load
The top command is particularly useful when trying to determine how many processors your jobs are using.
For instance, suppose you see multiple jobs running on node (including yours) and your check of the load indicates that node is being over-utilized.
How could you tell whether it was your process or someone else's? The "top" command helps breakdown CPU utilization by process:
n007:~$ top
  top - 14:01:15 up 150 days, 22:43,  1 user,  load average: 64.10, 63.75, 63.52
  Tasks: 716 total,  65 running, 651 sleeping,   0 stopped,   0 zombie
  %Cpu(s): 99.1 us,  0.9 sy,  0.0 ni,  0.0 id,  0.0 wa,  0.0 hi,  0.0 si,  0.0 st
  KiB Mem : 26379443+total, 21490476+free, 36416432 used, 12473228 buff/cache
  KiB Swap:        0 total,        0 free,        0 used. 21900358+avail Mem

  PID USER      PR  NI    VIRT    RES    SHR S  %CPU %MEM     TIME+ COMMAND
  2080 user1     20   0   10.2g 427328  85664 R 100.0  0.2  11:55.89 vasp_std
  2081 user1     20   0   10.2g 404920  64316 R 100.0  0.2  11:55.70 vasp_std
  2082 user1     20   0   10.2g 390936  57336 R 100.0  0.1  11:56.08 vasp_std
  2083 user1     20   0   10.2g 415048  78996 R 100.0  0.2  11:55.64 vasp_std
  ...
  2144 user1     20   0   10.2g 388968  84112 R  99.0  0.1  13:19.48 vasp_std
  365  root      20   0       0      0      0 S   0.3  0.0   0:07.53 kworker/8:1
  373  root      20   0       0      0      0 S   0.3  0.0   0:07.10 kworker/5:1
  2718 root      20   0  173692   3012   1624 R   0.3  0.0   0:00.74 top
Restricted SSH access
Pleas note that you can directly access only nodes, where your application is running. When the job is finished, your connection will be terminated as well.